for statistics
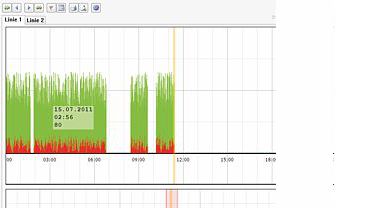
TEMA STATISTICS GRAPH is a process info tool which provides a clear overview and graphical display of the production and inspection process data.
Basic features:
- Diagram of performance figures in relation to time, shift, and production line
- Display of good and bad quality
- Configurable main display
- Selection of current and past data
- SQL data base connection
Advantages:
- All performance figures at a glance
- Information on events and parameter changes
- Determination of critical production periods
- Best benefit through configurable displays, reports, and filters


